Inland Empire Home Prices in October 2026: Nine Cities Compared
By Luc DeBonis, REALTOR® with Keller Williams Redlands | Published November 2026 | Data: CRMLS, pulled November 5, 2026
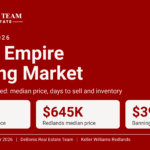
In October 2026 the median home sold for about $640K in Riverside, $635K in Redlands, $534K in Moreno Valley and $504K in Beaumont, down to about $410K in Hemet and $395K in Banning, based on CRMLS residential sales. The median price was below October 2025 in all nine cities, by anywhere from under 1% (Hemet, Redlands) to about 6% (Calimesa). Moreno Valley homes closed fastest at 15 days and Banning slowest at 44. Moreno Valley and Riverside had the tightest inventory at about 3.6 and 4.0 months of supply, while Beaumont had the most at about 8.8.
What Did Homes Sell for in the Nine Inland Empire Cities in October 2026?
The table below puts all nine cities side by side. Prices and days to sell are medians, which means half of the homes sold for more or closed faster and half for less or slower.
| City | Median sold price | Median days to sell | Closed sales | Active listings | Months of supply | Price vs Oct 2025 |
|---|---|---|---|---|---|---|
| Redlands | $635,000 | 30 | 45 | 207 | 4.6 | -0.8% |
| Beaumont | $503,750 | 32 | 52 | 459 | 8.8 | -4.0% |
| Riverside | $640,000 | 27 | 172 | 687 | 4.0 | -2.9% |
| Banning | $395,000 | 44 | 59 | 369 | 6.3 | -5.3% |
| Yucaipa | $579,000 | 23 | 35 | 209 | 6.0 | -1.6% |
| Calimesa | $550,000 | 28 | 6 | 34 | 5.7 | -6.0% |
| Moreno Valley | $534,000 | 15 | 103 | 371 | 3.6 | -4.6% |
| Hemet | $410,000 | 32 | 117 | 683 | 5.8 | -0.7% |
| San Jacinto | $485,000 | 21 | 38 | 255 | 6.7 | -2.6% |
Source: CRMLS, residential sales, October 2026, pulled November 5, 2026. Active listings are the count shown for the month. Months of supply is active listings divided by closed sales. Figures are medians; small cities move more month to month.
Which Cities Saw Prices Move the Most Since Last October?
Compared with October 2025, the median sold price was lower in all nine cities. Hemet (about 1% lower), Redlands (about 1%) and Yucaipa (about 2%) were closest to flat. Riverside and San Jacinto were each about 3% lower, Moreno Valley about 5%, Banning about 5% and Beaumont about 4%. Calimesa showed the biggest drop, about 6%, but it had only 6 closed sales, so its numbers can swing a lot from one month to the next. Banning homes sold for about 90% of the median list price, the lowest ratio of the nine cities.
How Fast Did Homes Sell?
Moreno Valley was the quickest at a median of 15 days to sell, followed by San Jacinto (21 days) and Yucaipa (23). Riverside took 27, Calimesa 28 and Redlands 30. Beaumont and Hemet were at 32 and Banning took 44 days, up from 17 in September and close to its 41 days in October 2025, so September looks like the unusual month there.
How Much Inventory Is on the Market?
Months of supply shows how long the current homes for sale would last at the month’s pace of sales. Moreno Valley sits near 3.6 months and Riverside near 4. Redlands is about 4.6, Calimesa about 5.7 and Hemet about 5.8. Yucaipa is at 6.0, Banning about 6.3 and San Jacinto about 6.7, while Beaumont (about 8.8) has the most homes available relative to how many are selling.
How Did Redlands Do in October 2026?
Redlands recorded 45 closed sales, down about 12% from 51 in October 2025 and down from 61 in September, at a median of about $635K and a median of 30 days to sell. The median price per square foot was about $365. The most recent Redlands numbers are on our Redlands housing market page.
Note on price per square foot: September’s figure used the CRMLS Stats statistic, while October’s is the median of the individual sales (the Search method), so the two months are not comparable.
Where Can You See Your City’s Latest Numbers?
If you want to know what a specific home would sell for, start with your city’s page: Redlands, Beaumont, Riverside, Banning, Yucaipa, Calimesa, Moreno Valley, Hemet and San Jacinto.
What Is Your Home Worth in This Market?
Prices vary by street and by condition, not just by city. Find out what your home could sell for in today’s market. No pressure. No obligation.
Frequently Asked Questions
Where do these numbers come from?
CRMLS, the multiple listing service for our region, using its residential category (single-family homes and condos/townhomes together). Figures were pulled on November 5, 2026 for October 2026.
What is the difference between median and average?
The median is the middle value, so a few very expensive or very cheap sales do not skew it.
Why do small cities move so much?
With few sales in a month, one or two homes can change the median. Calimesa had 6 closed sales in October.
Is this a prediction?
No. It reports what already closed. Months of supply is a simple ratio, not a forecast.
About the Author
Luc DeBonis is a REALTOR® (DRE# 01996590) and principal of the DeBonis Real Estate Team at Keller Williams Redlands, helping buyers and sellers in Redlands, Beaumont, Riverside and the surrounding Inland Empire. Call (951) 203-4426 or email realtors@debonisteam.com. Office: 1473 Ford St #200, Redlands, CA 92373.
Information in this post is deemed reliable but not guaranteed. Market data is subject to change. Buyers and sellers are encouraged to independently verify all information through the appropriate real estate professionals prior to making any real estate decision.
DeBonis Real Estate Team | Keller Williams Realty | DRE# 01996590